
|
|
#1
 05-20-2012, 08:21 PM
|
|||
|
|||
|
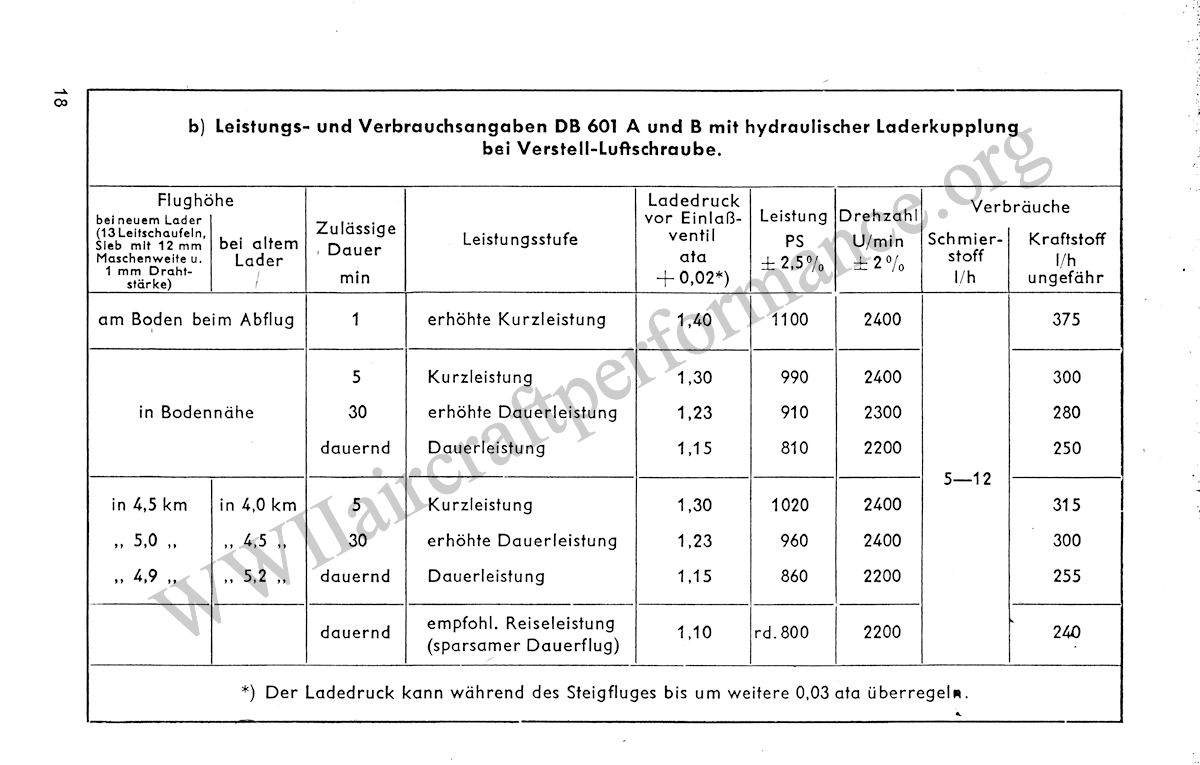
There seems to be something wrong. If I take up QM for a dogfight between 109s and [insert plane here], I always find that I am down to about 100 liters from max 400 liters really quick, in 10 minutes or so.
Even flying for 10-15 minutes at full power would not explain this. Fuel consumption of the DB 601 was about 330 liters PER HOUR at max output, the plane seem to swallow that amount six time faster. Is the fuel consumption rate simply multiplied to give 'feel' of the actual battle over London or something is seriously off here..?
__________________
Il-2Bugtracker: Feature #200: Missing 100 octane subtypes of Bf 109E and Bf 110C http://www.il2bugtracker.com/issues/200 Il-2Bugtracker: Bug #415: Spitfire Mk I, Ia, and Mk II: Stability and Control http://www.il2bugtracker.com/issues/415 Kurfürst - Your resource site on Bf 109 performance! http://kurfurst.org 

|
|
#2
05-20-2012, 10:44 PM
|
|||
|
|||
|
Fuel consumption was 375l/hr at full power.
|
|
#3
05-20-2012, 11:14 PM
|
||||
|
||||
|
Quote:
|
|
#4
05-21-2012, 12:09 AM
|
|||
|
|||
|
In some rough and dirty super quick Flight testing these are the Fuel Flow figures I got.
Spitfire IIA Climb +4/2800RPM 72gal hr. Book figures 94Gall hr Cruise +2/2600RPM 60gal hr. Book figures 78 gall hr BF109E4 Climb 1.35/2350 RPM (AUTO) 480Ltr/hr (106Gall/hr) Max Cruise 1.35/2400RPM 360 ltr per hr Blenheim IV I4000ft at +3Lbs Boost Full Coarse pitch. 30 Gall/hr per engine i.e 60Gall hr total Documented values 57Gall hr per Engine Total 114 Gall/hr Method was taking Tool tip displayed values over a number of samples (using a 5min sample) then averaging the result for each type and situation. Tool tip I think only displays Fuel qty to within 10units so a longer sample time (than 5 mins) would give better results. EDIT 20 Min Flight Test. BF109E4 1.35ATA/2350 AUTO Oil/Coolant Rads full open, Start Fuel 340Litres, Level flight Sea Level After 10 Mins Fuel Remaining 280Litres (Fuel Flow 360Ltr/hr) After 15 Mins Fuel Remaining 260Litres (Fuel Flow 320Ltr/hr) After 20 Mins Fuel Remaining 230Litres (Fuel Flow 330Ltr/hr) Average 336Ltr/Hr Which doesn't look to far off the figures in the chart posted by Al Schlagater. Last edited by IvanK; 05-21-2012 at 01:06 AM.
|
|
#5
05-21-2012, 01:03 AM
|
||||
|
||||
|
Quote:
|
|
#7
05-21-2012, 10:19 AM
|
|||
|
|||
|
Been writing a 109 campaign over the last few months so my experience of 109 fuel consumption ingame is based on this experience....
At full throttle consumption seems ~ right, maybe a little on the high side(depends which reference you believe What i do notice is consumption at cruise levels seems too low when boost is at lower levels, how much of this is due to being able to run at lower boost/rpm levels to maintain cruise flight might be the cause seems to me the question to be asking? This leads to a situation ingame where in a 'typical' bomber escort to london, the 109's have more fuel than they ought. i'm also finding a relationship between fuel level, discipline AI level and how long they will stay and fight before running for home. As a result i'm finding using down to~75% fuel level for 109's gives reasonable results- at least for me; ymmv)
|
|
#8
05-21-2012, 10:22 AM
|
|||
|
|||
|
Resuming, aprox in time and consum:
25 liters take off and climb to cruise altitude 128 liters cruise/30 minutes to the patrol area 100 liters /20 minutes of combat 128 liters cruise/30 minutes return to base 19 liters/aproach and landing TOTAL 400 liters
|
|
#9
06-11-2012, 10:46 AM
|
|||
|
|||
|
My bad, it seems the starting fuel capacity is low to start with, so it's not the consumption rate that causes you to end up with about 130 liters after a couple of minutes in the QM, but the fact that you start only with 170-180 liters (instead of 400).
The campaign seems uneffected. The probable cause for this is that it seems the Emil's weights and loading data is somewhat off in the sim. With full fuel load, you have a takeoff weight of 2701 kg, and the max. takeoff weight in the sim is just 2600 kg. It seems the sim simply takes away the 'surplus' fuel so you can't fly with the normal capacity of 400 liters in the QM. How on Earth the Emil ends up at +100 kg overload in a perfectly normal loadout conditions (100% fuel, 100% ammo, no bombs) is beyond me. It seems to be a bug.
__________________
Il-2Bugtracker: Feature #200: Missing 100 octane subtypes of Bf 109E and Bf 110C http://www.il2bugtracker.com/issues/200 Il-2Bugtracker: Bug #415: Spitfire Mk I, Ia, and Mk II: Stability and Control http://www.il2bugtracker.com/issues/415 Kurfürst - Your resource site on Bf 109 performance! http://kurfurst.org
|
|
#10
06-11-2012, 11:18 AM
|
|||
|
|||
|
Woow slow down everyone, please remember that the Luftwaffe fighters did not airspawn over the French coast and then fly to London and only have 15 mins of fuel before they had to head back...
They took off and spent 30-45 mins forming up and waiting for the big slow bombers to form as well... So before every starts screaming a 109 should only have 15 mins over London please use you brain! The fuel consumption table needs to be observed only for the purpose of this discussion... the 15 mins loiter over London should be ignored!
|
 |
|
|


 Linear Mode

