Fulqrum Publishing Home   |   Register   |   Today Posts   |   Members   |   UserCP   |   Calendar   |   Search   |   FAQ

Go Back   Official Fulqrum Publishing forum > Fulqrum Publishing > IL-2 Sturmovik: Cliffs of Dover > Technical threads > FM/DM threads

FM/DM threads Everything about FM/DM in CoD

Closed Thread
 
Thread Tools Display Modes
  #1  
Old 10-11-2012, 09:03 AM
Robo.'s Avatar
Robo. Robo. is offline
Approved Member
 
Join Date: Sep 2009
Location: Nottingham, UK
Posts: 658
Default

Quote:
Originally Posted by CaptainDoggles View Post
Well, given that we're currently on a beta patch, I think it would be best to wait for the final "release" version, to see if 1C fixes the broken flight models. With so much in flux it'd be a waste of effort if any testing will be thrown out in 3 months.
This is a very good point. Many things have changed (ever so slightly) in the recent beta patches, e.g. blackout modelling or Bf 109 slats behaviour. I am certain that there will be more changes in the final release.

Quote:
Originally Posted by CaptainDoggles View Post
As for the specific numbers you mention: I'd be hard pressed to pin down an exact number for the Spitfire's sustained turn rate advantage (but I agree that it exists in some small amount).
Josf mentions 25% advantage, but he did not mention how exactly he measured that. I also believe it exists (and rightly so) but I have to add that it very much depends on the pilot's skill (also quite rightly so).

Corner speed seems about right to me, but I would check with someone like LittleD who flies the 109 religiously. I myself have not been in-game very much lately, since the news that CLOD would likely not be fixed came down.

Quote:
Originally Posted by CaptainDoggles View Post
I agree that these things should be quantified (...)
I agree but I find even easier and more basic side of this sim difficult to measure. If you look at the FM tests (by IvanK, klem, Snapper, Felipe etc etc) there was always major issue with methodics - it is impossible to re-calculate the results for normal day, IAS vs TAS conversion is extremely difficult, the gauges are off.

As for Energy Maneuverability quantification - it should be measured if Josf prefers it that way but in that case I suggest he simply does it. I am not sure where is he going with the lengthy posts of his, asking trivial questions from one side.

Quote:
Originally Posted by CaptainDoggles View Post
In my experience, the problem is that people see a phrase like "Angles tactics are viable if your opponent is the Energy Fighter" and they think that that equates to flying circles on the deck, and allowing your opponent to have the initial advantage in every encounter.
I agree, but this has nothing to do with Josf's initial posts. I believe (and I am aware of the theory of aireal combat) that these are rough guidlines anyway, some basic boundaries and principles. In real combat encounter there is too many variables to be considered and it is impossible to quantify all of them. Biggest variable is the pilot's skill. As for angles fighter vs. energy fighter, I enjoy being the energy fighter flying the RAF planes. That would certainly not fit into Josf's theories.

Also, I offered many answers and I made several suggestions but Josf ignored them completely. I don't know why.
__________________
Bobika.
  #2  
Old 10-11-2012, 06:25 AM
MadBlaster MadBlaster is offline
Approved Member
 
Join Date: Oct 2010
Posts: 666
Default

Quote:
Originally Posted by JG14_Josf View Post


Notice how the two Accelerated Stall lines are not the same as would be expected if the Accelerated Stall lines were made the same because they were based ONLY on calculations. Those lines would be THE SAME shape if they were calculated instead of tested and plotted based upon test results.
They are probably different because they are based on flight tests, not calculations.
if I were to guess, and without knowing anything about this test, I think the lower red and blue curves are without g suit, the higher curves with g suit. if you notice, the convex points (most outward g value) for both the non-g suit curves (assuming that is correct assumption) is around 5.5. g curve. This value seems reasonable.

early ww2 planes, I do not believe were equipped with accelerometers to measure the g. Maybe the p47, iirc. So, this windup test, I don't think it is realistic to use that for your determination, if you wish to remain a faithful, non-quake pilot. If you start using g-meter, wonder woman view, or digging into the code, that might make you quake player by default.
  #3  
Old 10-11-2012, 07:20 AM
IvanK IvanK is offline
Approved Member
 
Join Date: Oct 2007
Location: Australia
Posts: 886
Default

Nothing to do with G Suits in this chart. The red and Blue convex lines merely represent the sustained G that each aircraft can pull without energy loss i.e. Ps=0. The Red line represents the Mig15 sustained turn boundary, The Blue line the F86F (doesnt say hard or slatted wing) sustained turn boundary. The left hand margin is the Lift limit, the top the structural limit, the RHS the Vmax limit.

This chart is pretty historical as it was one of Boyds first comparative EM charts. It is my belief that this chart was in fact based totally on calculation. Its origin is I believe from a presentation Vu graph used by Boyd in one of his early presentations. The original graph was taken from Boyds archival papers. I recall its covered in the book "Boyd the fighter pilot that changed history" by Coram.

Last edited by IvanK; 10-11-2012 at 07:28 AM.
  #4  
Old 10-11-2012, 07:31 AM
MadBlaster MadBlaster is offline
Approved Member
 
Join Date: Oct 2010
Posts: 666
Default

Quote:
Originally Posted by IvanK View Post
Nothing to do with G Suits in this chart. The red and Blue convex lines merely represent the sustained G that each aircraft can pull without energy loss i.e. Ps=0. The Red line represents the Mig15 sustained turn boundary, The Blue line the F86F (doesnt say hard or slatted wing) sustained turn boundary. The left hand marhin is the Lift limit, the top the structural limit, the RHS the Vmax limit.

This chart is pretty historical as it was one of Boyds first comparative EM charts. It is my belief that this chart was in fact based totally on calculation. Its origin is I believe from a presentation Vu graph used by Boyd in one of his early presentations. The original graph was taken from Boyds archival papers. I recall its covered in the book "Boyd the fighter pilot that changed history" by Coram.
ah well thanks for clarification. it seems coincidence though. wiki says gloc occurs around 5 g for average human. so to get to those outer performance curves, you would need a g suit.

so, i wonder if the lower curves maybe are just normal operating curves and the outer ones, performance curves under combat condition, or something like that?
  #5  
Old 10-11-2012, 07:36 AM
JG14_Josf JG14_Josf is offline
Approved Member
 
Join Date: Oct 2012
Posts: 32
Default

Quote:
I think the lower red and blue curves are without g suit, the higher curves with g suit.
Please consider the possibility that the Corner Speed point at the top of the graph is the maximum turn performance for those planes as they were flown during testing by Chuck Yeager and John Boyd as they had available to them a captured Mig and F-86s. John Boyd was working on finding out why the F-86 was defeating the Migs.

Note the much smaller turn rate for the F-86 and the much faster turn rate despite the Mig 15 pushed to a higher g on that graph.

The other curves are Sustained Turn Performance curves or Specific Excess Power at 0, or Ps=0 whereby the plane is not gaining or losing any energy while it is on that line at those speeds, those g loads, and that line is a turn at those speeds, full power, where the pilot is flying a plane in a turn not gaining or losing altitude and the far right point is Top Speed and as soon as the pilot starts turning in a level turn a new plot is added to the line and the pilot could stay at that plot with a very wide turn not gaining and not losing altitude, and the pilot can tighten the turn and make a new plot, not gaining altitude, not losing altitude, not accelerating, not decelerating, flying at that bank angle, full throttle, coordinated turn, full power, and if the bank angle is moved even steeper, and steeper, maintaining level flight, the end result is a stall and that is the far left point on that lower curve which is The Sustained Turn Performance Envelope, and notice, please, how the Mig is much better at Sustained Turns compared to the F-86 except if both planes are turning a Sustained Turn at speeds above .7 Mach at which time the F-86 can out turn the Mig if the Mig pilot tried to follow at that airspeed (but the Mig can just cut the turn).

The obvious interesting observation that may be inspired by the differences in the Accelerated Stall line, if you are now following the meaning of those line on that chart, is the question as to why the Mig Accelerated Stall Performance Deteriorates rapidly with speed compared to the F-86.

If you have the Corner Speed g load LINE confused as a g suit line and you have the Sustained Turn Performance LINE confused with a non g suit line, then you may also have the Accelerated Stall LINE confused too.

I don't know, but I appreciate the effort to learn from those Charts because they are made for a very specific reason relative to Energy Maneuverability which is the modern method of quantifying the specific advantages one plane has over another plane UNAMBIGUOUSLY.

Interesting to that end is the concept of wing deformation under g load and such things could be factors contributing to changes in the theoretical or calculated accelerated stall line as the actual plane can or cannot actually fly on that theoretical ideal Accelerated Stall Line.

The Fw190, in particular, as reported by more than one source, was known to have a wing that deformed under g, and the twist would twist out of it, causing the plane to become less stable, to the point where the pilot had to relax stick pressure or the g load would increase because the wing deformed and therefore lift forces were increasing as the washout was untwisted from the wing.

If you want I can site sources. I have one source on the shelf in the form of a book by Eric Brown who was a World War II test pilot (British).

Last edited by JG14_Josf; 10-11-2012 at 07:39 AM.
  #6  
Old 10-11-2012, 09:12 AM
Robo.'s Avatar
Robo. Robo. is offline
Approved Member
 
Join Date: Sep 2009
Location: Nottingham, UK
Posts: 658
Default

Quote:
Originally Posted by JG14_Josf View Post
The other curves are Sustained Turn Performance curves or Specific Excess Power at 0, or Ps=0 whereby the plane is not gaining or losing any energy while it is on that line at those speeds, those g loads, and that line is a turn at those speeds, full power, where the pilot is flying a plane in a turn not gaining or losing altitude and the far right point is Top Speed and as soon as the pilot starts turning in a level turn a new plot is added to the line and the pilot could stay at that plot with a very wide turn not gaining and not losing altitude, and the pilot can tighten the turn and make a new plot, not gaining altitude, not losing altitude, not accelerating, not decelerating, flying at that bank angle, full throttle, coordinated turn, full power, and if the bank angle is moved even steeper, and steeper, maintaining level flight, the end result is a stall and that is the far left point on that lower curve which is The Sustained Turn Performance Envelope, and notice, please, how the Mig is much better at Sustained Turns compared to the F-86 except if both planes are turning a Sustained Turn at speeds above .7 Mach at which time the F-86 can out turn the Mig if the Mig pilot tried to follow at that airspeed (but the Mig can just cut the turn).
Very well, we had this very conversation just couple of weeks ago, doghouse of Spitfire Mk.I and Bf 109E. The last bit in the brackets is what forum user Crumpp failed to understand. He is now unfortunately banned from the forums so he can not add anything to that discussion.

It was established though that the speed at which the 109 gains upper hand in sustained turn parameter is 400kph (equivalent of those 0.7mach in the Sabre vs. MiG graph).

Would you would mind going back to my posts and answer my questions taht would be greatly appreciated. I went long distance (literally lol) reading your posts and replying in detail.
__________________
Bobika.
  #7  
Old 10-11-2012, 02:11 PM
MadBlaster MadBlaster is offline
Approved Member
 
Join Date: Oct 2010
Posts: 666
Default

Quote:
Originally Posted by JG14_Josf View Post
The other curves are Sustained Turn Performance curves or Specific Excess Power at 0, or Ps=0 whereby the plane is not gaining or losing any energy while it is on that line at those speeds, those g loads, and that line is a turn at those speeds, full power, where the pilot is flying a plane in a turn not gaining or losing altitude and the far right point is Top Speed and as soon as the pilot starts turning in a level turn a new plot is added to the line and the pilot could stay at that plot with a very wide turn not gaining and not losing altitude, and the pilot can tighten the turn and make a new plot, not gaining altitude, not losing altitude, not accelerating, not decelerating, flying at that bank angle, full throttle, coordinated turn, full power, and if the bank angle is moved even steeper, and steeper, maintaining level flight, the end result is a stall and that is the far left point on that lower curve which is The Sustained Turn Performance Envelope, and notice, please, how the Mig is much better at Sustained Turns compared to the F-86 except if both planes are turning a Sustained Turn at speeds above .7 Mach at which time the F-86 can out turn the Mig if the Mig pilot tried to follow at that airspeed (but the Mig can just cut the turn).
I think this test could be re-created in game. Four pylon type objects set up in box pattern, equi-distant, as lying on the edge of the imaginary turning circle. Fly the circle, note the time of completion from 0 to 360 degrees and IAS. Deviation from the flight path is fail. Loss of alitude is fail. As per above, follow each successful completion with another test. Shorten the distance between the pylons by some incremental amount. Repeat until the test can no longer be completed without loss of altitude or deviation from the flight path. I don't even think you need g meter. But I guess it would be helpful while conducting the test to make sure you are flying constant g.The test I described before, I think that would give you the instantaneous value. So, if you think 109 v spit diagrams are similar to mig v sabre? Then I agree with you. You need to do both type of test, sustained and instantaneous turn rate, to get full picture. I think. Probably would need to use device link and make tracks of each test to ensure flight path is followed, altitude is maintained, full power settings, ...etc. If your at sea level, need for tas conversion may not be necessary. I guess it boils down to how accurate you want to be in this.
  #8  
Old 10-11-2012, 06:52 PM
TomcatViP TomcatViP is offline
Approved Member
 
Join Date: Aug 2010
Posts: 1,323
Default

Quote:
Originally Posted by JG14_Josf View Post
Please consider the possibility that the Corner Speed point at the top of the graph is the maximum turn performance for those planes as they were flown during testing by Chuck Yeager and John Boyd as they had available to them a captured Mig and F-86s. John Boyd was working on finding out why the F-86 was defeating the Migs.

Note the much smaller turn rate for the F-86 and the much faster turn rate despite the Mig 15 pushed to a higher g on that graph.

The other curves are Sustained Turn Performance curves or Specific Excess Power at 0, or Ps=0 whereby the plane is not gaining or losing any energy while it is on that line at those speeds, those g loads, and that line is a turn at those speeds, full power, where the pilot is flying a plane in a turn not gaining or losing altitude and the far right point is Top Speed and as soon as the pilot starts turning in a level turn a new plot is added to the line and the pilot could stay at that plot with a very wide turn not gaining and not losing altitude, and the pilot can tighten the turn and make a new plot, not gaining altitude, not losing altitude, not accelerating, not decelerating, flying at that bank angle, full throttle, coordinated turn, full power, and if the bank angle is moved even steeper, and steeper, maintaining level flight, the end result is a stall and that is the far left point on that lower curve which is The Sustained Turn Performance Envelope, and notice, please, how the Mig is much better at Sustained Turns compared to the F-86 except if both planes are turning a Sustained Turn at speeds above .7 Mach at which time the F-86 can out turn the Mig if the Mig pilot tried to follow at that airspeed (but the Mig can just cut the turn).

The obvious interesting observation that may be inspired by the differences in the Accelerated Stall line, if you are now following the meaning of those line on that chart, is the question as to why the Mig Accelerated Stall Performance Deteriorates rapidly with speed compared to the F-86.

If you have the Corner Speed g load LINE confused as a g suit line and you have the Sustained Turn Performance LINE confused with a non g suit line, then you may also have the Accelerated Stall LINE confused too.

I don't know, but I appreciate the effort to learn from those Charts because they are made for a very specific reason relative to Energy Maneuverability which is the modern method of quantifying the specific advantages one plane has over another plane UNAMBIGUOUSLY.

Interesting to that end is the concept of wing deformation under g load and such things could be factors contributing to changes in the theoretical or calculated accelerated stall line as the actual plane can or cannot actually fly on that theoretical ideal Accelerated Stall Line.

The Fw190, in particular, as reported by more than one source, was known to have a wing that deformed under g, and the twist would twist out of it, causing the plane to become less stable, to the point where the pilot had to relax stick pressure or the g load would increase because the wing deformed and therefore lift forces were increasing as the washout was untwisted from the wing.

If you want I can site sources. I have one source on the shelf in the form of a book by Eric Brown who was a World War II test pilot (British).
Simply said, a faster plane fighting at higher speed will loose less E than a slower plane fighting him at the same speed. So keep your Speed high and turn fast. Soomething that some here never agreed to understand (by conformism). Great to hear your voice on that theme here !


Illustration:
1.Kelly J. was never ashamed of the 104 small wing.... He was asked to build a high manoevrable supersonic plane !
2. this where the canards Eu planes are missing the 5th gen contest (the Raf being the less affected in fact): too draggy at high speed to really move like a fish!

EDIT: there is some archive movies on Youtube with Yeager and Boyd flying the 15. I think I posted somewhere (Warclouds ?) a link to a doc

Last edited by TomcatViP; 10-11-2012 at 07:08 PM.
  #9  
Old 10-11-2012, 02:19 AM
JG14_Josf JG14_Josf is offline
Approved Member
 
Join Date: Oct 2012
Posts: 32
Default

In case there continues to be misunderstanding, despite repeating the same questions over and over again, here is a repeat of the same questions over again.

http://forum.1cpublishing.eu/showthread.php?t=34290

That is the Original Post

So as to reinforce the understanding that I am not unique, or alone, in the interest in Corner Velocity as one of the important measures of Energy Maneuverability here is the quote from the Original Poster:

Quote:
Cornering Speed: "The lowest air speed at which a fighter can obtain the structural or aerodynamic limiting G force."

In the "dogfight" situation, this is the speed I'm trying to maintain in order to "out-turn" an adversary. It's also the speed above which I must excercise caution to prevent "Over-G" damage. Below this speed I must remain "Stall vigilant.

Is there a central location where the cornering speeds of CLoD aircraft can be found?

I'm in love with the Spitfire MKII, so that would be a good starting point...
Here is a source of information concerning how the information can be gathered:

http://www.aviation.org.uk/docs/flig...-FTM108/c6.pdf

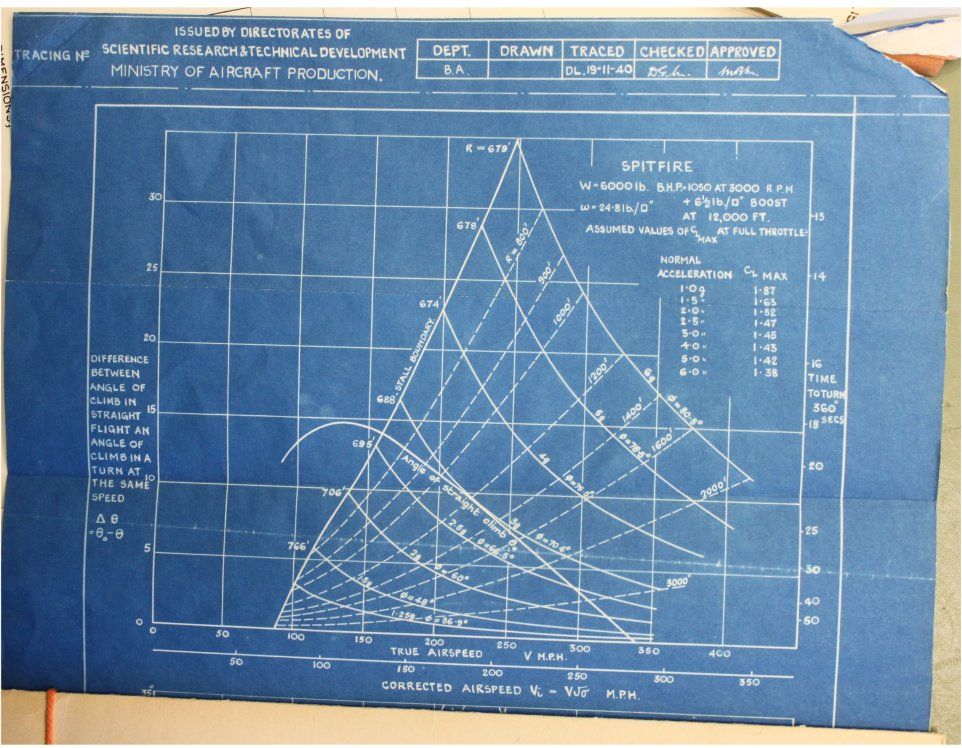
Here are what appear to be calculated Energy Maneuverability Charts done in World War II for the Spitfire and the 109:
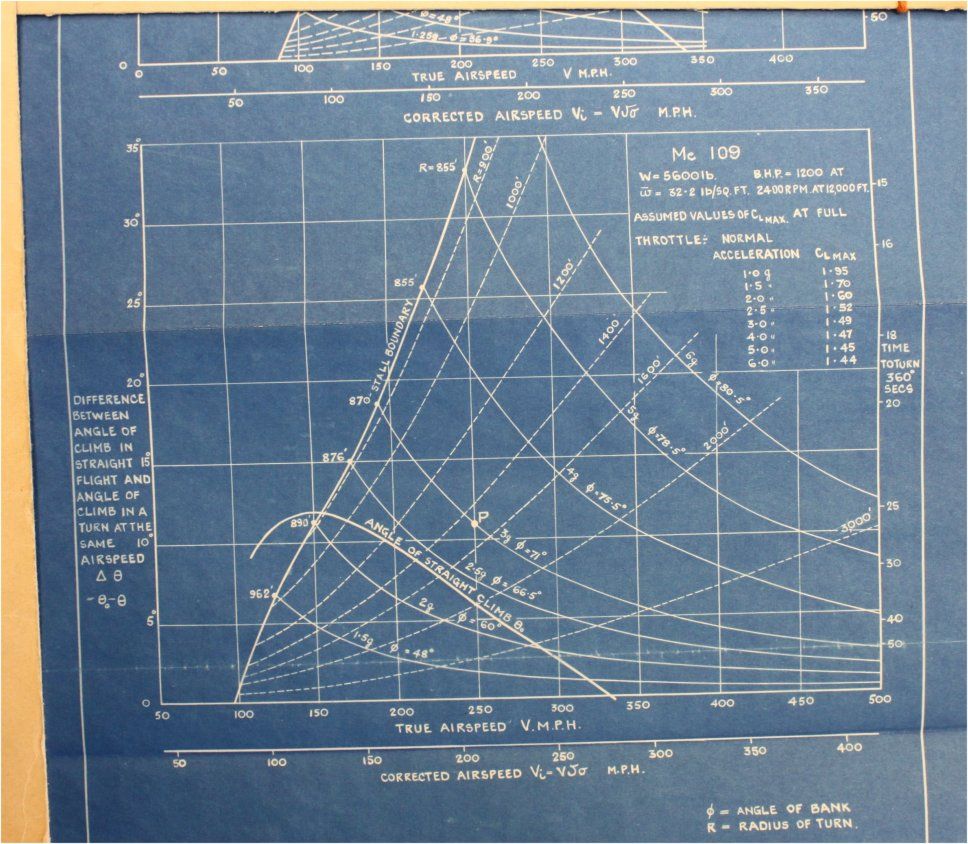


Here is the thread and the document that may be referring to those charts:

http://forum.1cpublishing.eu/showthr...t=33720&page=6

Here is the direct download from that thread describing what appears to be the production of those charts AND much in the way of how the British compared their Spitfires to the captured 109 they tested and reported on in that downloadable document:

https://www.dropbox.com/s/wtmfqxlon7...ing%20test.pdf

Here is a quote from that document concerning what may be those Spitfire and 109 Energy Maneuverability Charts:

Quote:
In a recent report on the dog-fight Gates gives an analysis whereby the performance of an aircraft in steady spiral flight at full throttle can be estimated from its measured full throttle performance in straight flight (partial climbs and top speed): the analysis leads to a compact diagram from which the radius and the time of turn, and the corresponding rate of ascent or decent can be obtained at any given airspeed and normal g.
Such diagrams have been constructed for the Spitfire and the Me 109, and are given in Fig. 17, together with an explanation of their use. The turning performance of the Hurricane is probably little different from that of the Spitfire, these aircraft being roughly similar in wing loading and level performance. The “stall boundary” depends on the estimate of CLmax at full throttle. In the case of the Spitfire this has been measured in flight, while the Me.190 figures were based on the Spitfire results; tables of the assumed values of CLmax are given in Fig. 17. CLMax falls off as g is increases, because the stalling speed increases as g gets larger, thus lessening the slip-stream effect.
It will be seen that the minimum radius of turn without height loss is obtained by flying as near the stall as possible at a comparatively small g. For ease of comparison the radius of turn has been plotted against speed for both airplanes in Fig. 18, (i) for turns at the stall, and (ii) for turns without height loss. The advantages of the Spitfire over the Me.109 at once becomes apparent, the minimum radius of turn without loss of height being about 696 ft. on the Spitfire as against 885 ft. on the Me.109. The characteristics of these turns are summarized in the following table:
That appears to be speaking about the tables shown in the picture above, and now moving back to reality in the game.

There are 4 variables involved in Corner Speed and according to Robert Shaw and according to Math if you don't like Robert Shaw any 2 variables known can be used to calculate the other 2 variables.

Those variables are:

1.
Air Speed (true)
2.
g Force
3.
Turn Rate (degrees per second)
4.
Turn Radius

Mock combat was performed by British combat pilots when they captured enemy planes and there is documentation on those test.

Mock combat was performed by German combat pilots when they captured enemy planes and there is very little documentation on those tests.

We simulate combat, which is Mock combat in these games.

Example of Mock Combat taken from the British document found on this site, downloadable because a forum member makes that document available - thanks.

Quote:
When the 109 was following the Hurricane or Spitfire, it was found that our aircraft turned inside the Me.109 without difficulty when flown by determined pilots who were not afraid to pull their aircraft round hard in a tight turn. In a surprisingly large number of cases, however, the Me.109 succeeded in keeping on the tail of the Spitfire or Hurricane during these turning tests, merely because our pilots would not tighten up the turn sufficiently for fear of stalling and spinning.
Now turning to a major point of contention concerning the differences between accurate information and "good enough" information such as might be the information gathered carelessly and not subjected to any attempts to improve the information such as reinforcing data, whereby more than one qualified person is propped himself up as know it all of everything.

I don't know everything. I think that the 109 Corner Speed is at around 350 km/h indicated and so that will have to do until there are any other offerings from anyone else who may be able to find a more accurate number.

I can record the track file and find the time it takes to travel around one full circle.

Math can then be applied in the determination of Degrees per second since I will then have the time and the known number of 360 degrees traveled in that time.

Here, for any know it all people out there, not counterfeit know it all people, is a question on this topic that could help find a more accurate Corner Speed.

Is it possible to get any other of the 4 variables required to have at least 2 of the variables known precisely, so as to then know all 4 variables precisely to thereby know at least one example of one pilot flying at Corner Velocity in the game?

1.
Turn rate (easy to calculate based upon one 360 turn done in a specific amount of time.
2.
Air Speed (the gauge on the airplane is indicated and it does shake around a bit)
3.
g Force (If the game code is modelling a known pilot g force limit, such as 5 g, then this variable can be known for each plane being tested if the code is known, so if anyone knows if the code in the game has a known g force for any pilots simulated in any planes then please consider speaking up)
4.
Turn radius (if there were search lights placed on the ground at known distances or pylons or if a track file can be viewed to some measure of scale relative to an aircraft wingspan, then this could be a possible standard of measure for turn radius possibility otherwise the other variables have to be figure out more precisely)

If the turn rate is known then the length of the flight or circumference of the turn measure, if found out, can thereby be used to calculate air speed (true) and turn radius, and then g can be found out too.

If you look at a Dog House Plot you can see that they are mathematically calculated as representations of physical reality. A dot on the graph is a specific air speed, turn rate, g, and turn radius, no question, it is a physical fact, and all that is need to get on the chart is two of the four variables known somehow.

Then, without the math, or the charts, there is the reality that the game code offers, and if Corner Speeds can be known then the g Loads CODED for each pilot can be known too.

Are Spitfire pilots coded with higher g loads?

Are 109 pilots coded with higher g loads?

Would anyone like to know?

Is such information worthy of resort to personal attacks if such information were to be sought after by someone?
  #10  
Old 10-11-2012, 03:16 AM
MadBlaster MadBlaster is offline
Approved Member
 
Join Date: Oct 2010
Posts: 666
Default

I will try again. Not as expert, nor a rl pilot, but common sense applies by looking at the doghouse graph.

If
you fly straight
at top speed
at sea level
with full tank of gas

conclusion 1:
your are in the flight envelope

if you then
roll your plane 90 degrees left or right
and pull back on the stick
without exceeding the structural load limit

conclusion 2
you will experience ever increasing g force
you are still in the flight envelope

if you continue to
pull back on the stick
in an ever increasing fashion

conclusion 3
you will eventually hit the stall limit line via high speed stall.
You are no longer in the flight envelope at that moment.
you must pause the game at that moment in time, because
you have just found the peak of the doghouse
where load limit (g) line and stall limit line intersect at the maximum instantaneous turn rate of the plane you are flying under the current flying conditions.

For practical purposes,

The actual value of the turn rate is irrelevant.
The actual value of the turn radius is irrelevant.
The actual value of the g limit at that moment is irrelevant.
Blackouts can be made irrelevant, if they are turned off for testing purposes.
The IAS at that moment in your turn is relevant for the given flight conditions. As a player, that is the value you are after. You must sustain that speed for best cornering. Unless you are trying to “game” the game, so to speak. In that case, it is legitimate to call your motivations behind this thread into question, imho. If this information is incorrect, please, anybody, point it out. I would really like to know how it is off topic or incorrect or flaming or wth.

This post, similar to what I made earlier today and was deleted. It is not my fault CloD failed (off topic).
Closed Thread

Thread Tools
Display Modes

Posting Rules
You may not post new threads
You may not post replies
You may not post attachments
You may not edit your posts

BB code is On
Smilies are On
[IMG] code is On
HTML code is Off

Forum Jump


All times are GMT. The time now is 08:33 PM.


Powered by vBulletin® Version 3.8.4
Copyright ©2000 - 2026, Jelsoft Enterprises Ltd.
Copyright © 2007 Fulqrum Publishing. All rights reserved.