
Fulqrum Publishing Home   |   Register   |   Today Posts   |   Members   |   UserCP   |   Calendar   |   Search   |   FAQ

Go Back   Official Fulqrum Publishing forum > Fulqrum Publishing > IL-2 Sturmovik: Cliffs of Dover > Technical threads > FM/DM threads

FM/DM threads Everything about FM/DM in CoD

Reply
 
Thread Tools Display Modes
  #1  
Old 09-19-2012, 03:46 AM
Crumpp's Avatar
Crumpp Crumpp is offline
Approved Member
 
Join Date: Feb 2008
Posts: 1,552
Default

Quote:
There's no engine rating shown
The data is listed in the thread.

Here it is too, right off the spreadsheet:

Spitfire Mk I

Aircraft Data
weight 6050lbs
Power 990bhp
Level speed 247KEAS
Propeller efficiency 0.8
Wing area 242 sqft
wing efficiency 0.85
Dynamic pressure 206.8101695psf
Aspect Ratio 5.6
Mass 187.8881988 ft/s^2


Bf-109E-3

Aircraft Data
weight 5580lbs
Power 990bhp
Level speed 269KEAS
Propeller efficiency 0.85
Wing area 174.9 sqft
wing efficiency 0.85
Dynamic pressure 245.2915254
Aspect Ratio 5.77
Mass 173.2919255 ft/s^2
__________________

Last edited by Crumpp; 09-19-2012 at 03:59 AM.
Reply With Quote
  #2  
Old 09-19-2012, 03:59 AM
Crumpp's Avatar
Crumpp Crumpp is offline
Approved Member
 
Join Date: Feb 2008
Posts: 1,552
Default

Quote:
And what do we see on the 109 data?
Again, it just calls into question the validity of the RAE estimate. I just figured it was a given the RAE would not have the best data on the German aircraft.

They did a lot of estimating off very few data points. The CLmax for both aircraft closely matches the full flaps CLmax and not clean configuration.
__________________
Reply With Quote
  #3  
Old 09-19-2012, 04:33 AM
IvanK IvanK is offline
Approved Member
 
Join Date: Oct 2007
Location: Australia
Posts: 886
Default

Quote:
Originally Posted by Crumpp View Post
Again, it just calls into question the validity of the RAE estimate. I just figured it was a given the RAE would not have the best data on the German aircraft.

They did a lot of estimating off very few data points. The CLmax for both aircraft closely matches the full flaps CLmax and not clean configuration.

Well clearly you haven't read AVIA 6/2934 They had reasonable data on the aircraft in question. AVIA 6/2934 is based on actual flight test of a BF109E3 in RAF hands.

Here is AVIA 6/2934 summary of turn performance based on Flight tests and calculation :
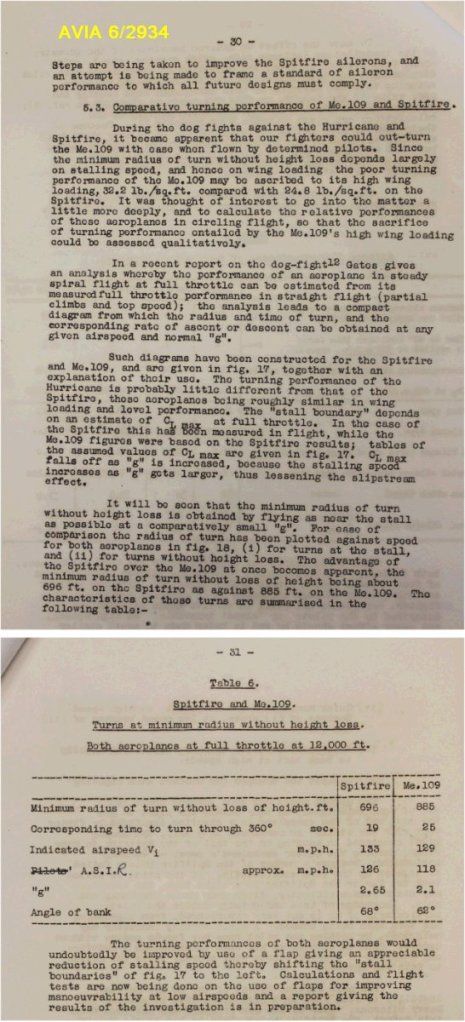


So the RAE determined the opposite to you based on flight test and calculation.
Reply With Quote
  #4  
Old 09-19-2012, 06:50 AM
Kurfürst Kurfürst is offline
Approved Member
 
Join Date: Oct 2007
Posts: 705
Default

Quote:
Originally Posted by IvanK View Post
So the RAE determined the opposite to you based on flight test and calculation.
To me it seems RAE determined something entirely different than Crumpp's calculation... (turns at and only at minimum turn radius vs. Crumpps calculations over the speed range)
__________________
Il-2Bugtracker: Feature #200: Missing 100 octane subtypes of Bf 109E and Bf 110C http://www.il2bugtracker.com/issues/200
Il-2Bugtracker: Bug #415: Spitfire Mk I, Ia, and Mk II: Stability and Control http://www.il2bugtracker.com/issues/415

Kurfürst - Your resource site on Bf 109 performance! http://kurfurst.org

Reply With Quote
  #5  
Old 09-19-2012, 06:55 AM
IvanK IvanK is offline
Approved Member
 
Join Date: Oct 2007
Location: Australia
Posts: 886
Default

The RAE chart on its own shows sustained G over the complete speed range at 12,000ft altitude.
Its the a similar but more detailed chart to Crumpps.
Reply With Quote
  #6  
Old 09-19-2012, 07:02 AM
Kurfürst Kurfürst is offline
Approved Member
 
Join Date: Oct 2007
Posts: 705
Default

Quote:
Originally Posted by IvanK View Post
The RAE chart on its own shows sustained G over the complete speed range at 12,000ft altitude.
Its the a similar but more detailed chart to Crumpps.
RAE's calculation also using estimated/guessworked stall speeds, Clmax and rather questionable power values for both the Spit and 109 (the latter probably understood with the effect of engine thrust). That's the problem with these charts in general - there's such a margin of error with the base values, that the results are all over the place. (estimated) Propeller effiency can vary results by 5-10% alone, drag values are unknown, the wing's oswald effiency factor is unknown (directly shifts the results, since its a multiplier in the equation), Cl max is unknown.

Just to make it clear I don't doubt the Spit had a sustained turn advantage at lower speeds, but OTOH I am pretty sure the situation reverses at higher speeds (for the 6 1/2 lbs version) at lower altitudes, since the 109E has both less drag and more power.

I am also curious about the effect of the two speed prop on turn capacity. Having 990 HP at the prop shaft is nice, but its all for naught if the two pitch prop can't properly convert it into thrust at turning speeds.
__________________
Il-2Bugtracker: Feature #200: Missing 100 octane subtypes of Bf 109E and Bf 110C http://www.il2bugtracker.com/issues/200
Il-2Bugtracker: Bug #415: Spitfire Mk I, Ia, and Mk II: Stability and Control http://www.il2bugtracker.com/issues/415

Kurfürst - Your resource site on Bf 109 performance! http://kurfurst.org
Reply With Quote
  #7  
Old 09-19-2012, 07:48 AM
IvanK IvanK is offline
Approved Member
 
Join Date: Oct 2007
Location: Australia
Posts: 886
Default

The RAE chart shows a Spitfire sustained turn advantage across the entire speed range from the Lift limit through to the max 1G sustained speed of around 340mph.

i.e. if the "Angle of straight climb" (Ps=0) for both the Spitfire and BF109 were overlayed on the same chart the Spitfire angle of straight climb would be above the 109 line from the Lift limit through to 1G Vmax. So at any speed in this range the Spit can sustain a higher G according to the RAE .... but not according to the Crumpp plot ... at any speed.

Both aircraft in this chart having similar values of 1g Vmax at the charted altitude.

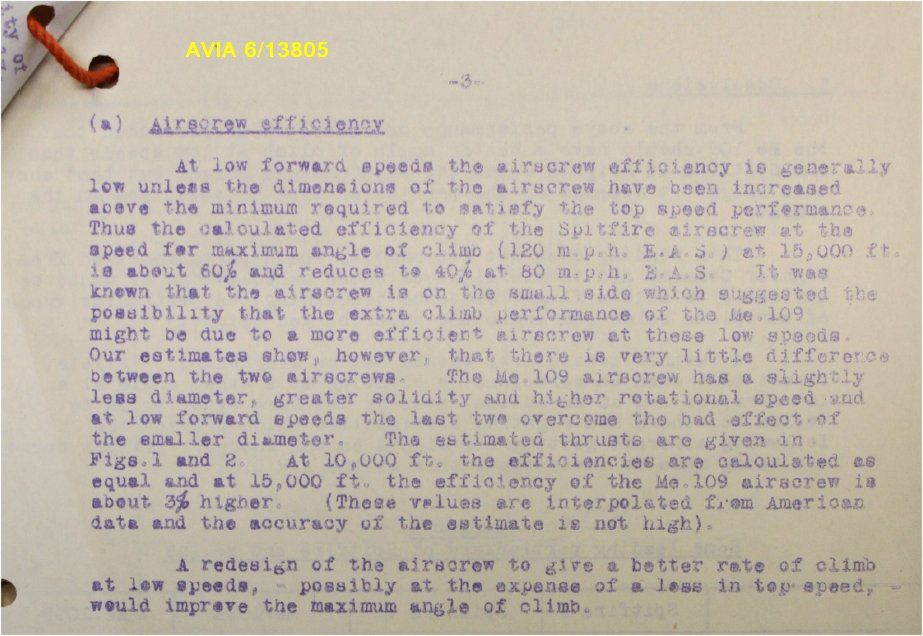
There is no mention of prop type in the AVIA report for either the Spitfire or the 109. I take your point on propeller efficiency though ... that is touched on in another AVIA report (AVIA 6/13805) in which the RAE believe the 109 and Spit prop efficiency was essentially the same at 10,000ft with the 109 around 3% better at 15,000ft.... though with caveats.

Last edited by IvanK; 09-19-2012 at 07:56 AM.
Reply With Quote
  #8  
Old 09-19-2012, 09:02 AM
NZtyphoon NZtyphoon is offline
Approved Member
 
Join Date: Feb 2012
Location: NZ
Posts: 543
Default

Quote:
Originally Posted by Crumpp View Post
The data is listed in the thread.

Here it is too, right off the spreadsheet:
Bf-109E-3

Aircraft Data
weight 5580lbs
Power 990bhp
Level speed 269KEAS
Propeller efficiency 0.85
Wing area 174.9 sqft
wing efficiency 0.85
Dynamic pressure 245.2915254
Aspect Ratio 5.77
Mass 173.2919255 ft/s^2
Interesting how the Bf 109E-3 loading chart http://www.wwiiaircraftperformance.o...ladeplanes.jpg shows the weights as 2,608 kg (5,749 lbs) fully loaded for combat while, without ammunition for training flights, the weight is 2,532kg (5,582 lbs)...
Reply With Quote
  #9  
Old 09-23-2012, 12:03 AM
NZtyphoon NZtyphoon is offline
Approved Member
 
Join Date: Feb 2012
Location: NZ
Posts: 543
Default

Quote:
Originally Posted by Crumpp View Post
The data is listed in the thread.

Here it is too, right off the spreadsheet:

Spitfire Mk I

Aircraft Data
weight 6050lbs
Power 990bhp
Level speed 247KEAS
Propeller efficiency 0.8
Wing area 242 sqft
wing efficiency 0.85
Dynamic pressure 206.8101695psf
Aspect Ratio 5.6
Mass 187.8881988 ft/s^2
Where did you assume the propeller efficiency was 0.8?
De H 55409 B 0.930

Rotol RA 611 0.924
Rotol RA 621 0.920
Rotol RA 600 0.911
Rotol RA 640 0.940

Take your pick, which propeller did you claim had an efficiency of 0.8?


http://www.spitfireperformance.com/spit2prop-b.jpg
Reply With Quote
  #10  
Old 09-23-2012, 12:34 AM
Crumpp's Avatar
Crumpp Crumpp is offline
Approved Member
 
Join Date: Feb 2008
Posts: 1,552
Default

Quote:
Take your pick, which propeller did you claim had an efficiency of 0.8?
That is a standard assumption in aircraft performance for power producers. It assumes a good propeller design.

The data listed below is peak efficiency which is a small part of the advance ratio curve. When you average out the entire curve, it comes out to ~.8 for a well designed propeller.

Quote:
Rotol RA 611 0.924
Rotol RA 621 0.920
Rotol RA 600 0.911
Rotol RA 640 0.940
__________________
Reply With Quote
Reply

Thread Tools
Display Modes

Posting Rules
You may not post new threads
You may not post replies
You may not post attachments
You may not edit your posts

BB code is On
Smilies are On
[IMG] code is On
HTML code is Off

Forum Jump


All times are GMT. The time now is 11:10 AM.


Powered by vBulletin® Version 3.8.4
Copyright ©2000 - 2026, Jelsoft Enterprises Ltd.
Copyright © 2007 Fulqrum Publishing. All rights reserved.