Quote:
Originally Posted by IvanK

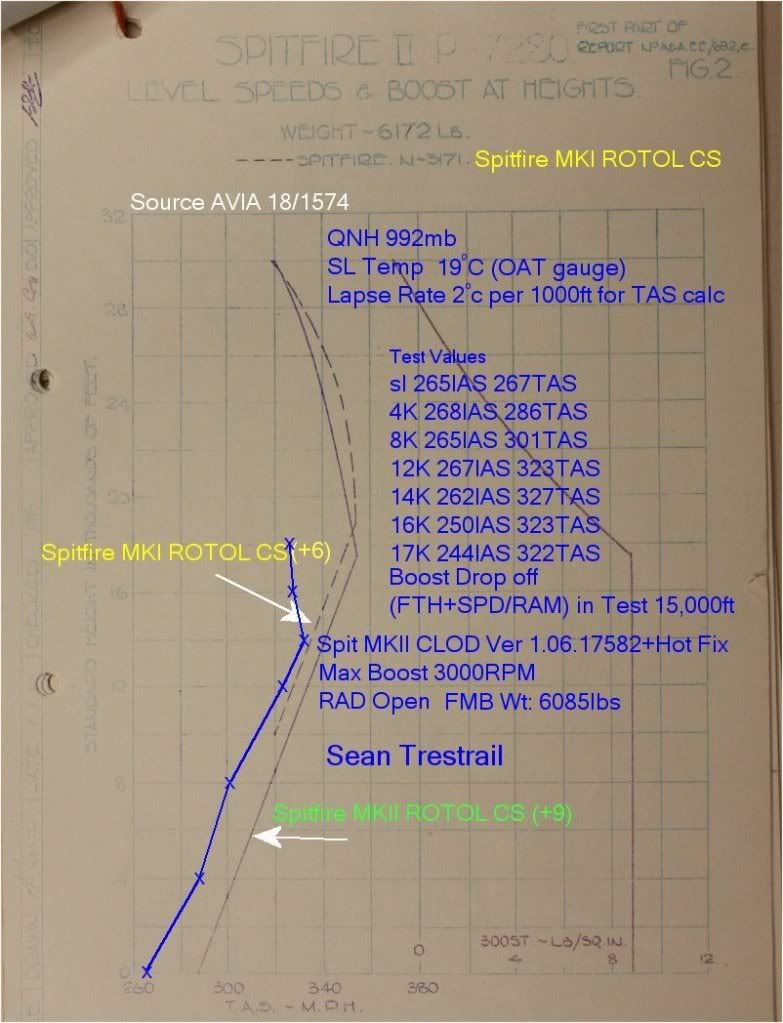
Attached graphic is my Speed test in CLOD current version + Hot fix.
Blue Line my results, Broken line Spit I spec, full line Spit II spec
METHOD
Each run commenced on altitude with stabilised Oil/Rad temps Oil Temp at 80deg C. Rad Full open (At present I cannot detect any Rad drag so radiator position is not relevant imo)
Each altitude was a specific FMB set up. Altitude maintained +-50ft throughout the test. QNH checked as 992mb on the specific map used.
Each run done 3 times and Vmax average plotted.
Seal level temp estimated 19 deg C based on HEIII OAT gauge on the same map on the ground. TAS calculation based on standard 2 deg C lapse rate from the surface. so at 16,000ft I was using an OAT of -13deg C
My test wt 114lbs less as reported by FMB than the spec wt
Power setting was Full throttle with 3000 RPM. Indicated Boost +6. Now its important to understand that displayed Boost is not I believe actually measured in the FM but represents an angular animation value. We all know that it should be indicating +9 in the Spit II.
I gave up testing at 17,000ft as things were radically different from the spec values.
Results plotted as accurately as I could.
If someone wants to convert the test values to Standard day figures ... go for it. |
For what its worth I did some quick tests on max speed in the Spitfire MkII, collecting data through a BlackBox script and converted them to standard day TAS's The results may not be perfect but they are close enough to show the Spitfire MkII appears to be just below the A&AEE tests of 1940 which is where IvanK puts it too.
I'm not an aviation expert but google was my friend so if the following is wrong well, just say so.
I took the CoD MkII I.A.S. as 'good' and equal to Calibrated Airspeed CAS (assumed no position errors etc). I held ROC as near zero as possible but its a b*tch to trim on my rotary but I took representative data from a consecutive set of near-zero ROC data. I ran with Rad open at max boost and max rpm (scripted out as 2990-2992) although the A&AEE tests used 2850 and I never achieved their 8.8 boost although it did creep up with altitude. The Altimeter can only be set in whole millibars so can't be set accurately (about 15ft out at SL, 430ft at 10,000) but I used it because the pressure altitude calculation uses the mb set in the Alltimeter. I got the true height from Script but did not use it so that's a point of contention.
I took formulae from here:-
http://williams.best.vwh.net/avform.htm#Mach
and...
I used TAS = CAS/(1-6.8755856*10^-6 * D_Alt)^2.127940
... where D_Alt is Density Altitude for <36,089.24ft)
I used Density altitude (D_Alt) = P_Alt +(StdTemp0/.0019812)*(1-(StdTemp0/OAT)^0.2349690)
... where StdTemp is 273.15K, OAT is scripted out Temperature (290k dropping to 270k) and P_Alt is Pressure Altitude = Indicated_Alt+145442.2*(1- (alt_set/1013.25)^0.190261)
... and alt_set was 995mb which is the nearest I can set it for the true height of Tangmere airfield (39.1ft True from script vs 25.46 indicated. I happen to know Tangmere is about 12.5m/39ft.)
Don't be fogged by 'science', if I got it wrong just say so, otherwise here's the chart showing CoD Spitfire MkII TAS vs A&AEE MkI and MkII data for a standard day.