
|
|
|||||||
| IL-2 Sturmovik The famous combat flight simulator. |
|
|
Thread Tools | Display Modes |
|
#1
 02-12-2011, 06:01 PM
|
|||
|
|||
|
Hi folks! I've done some flight testing to find out the lift to drag ratios (L/D) of some of our planes in IL2FB 4.10.
The lift to drag ratio is the ratio between lift and total drag in steady-state flight at a certain speed (no turning involved). L/D ratios describe how aerodynamically clean (or dirty) a plane is. Also, the L/D ratio changes drastically with speed. Planes reach their best climb and their best power off glide at the speed with the highest L/D ratio. To dissect the steady state aerodynamics without interference from the engine i flew the tests in an engine off condition, 50 % fuel, prop pitch = 0, closed rads. I flew a set speed (TAS) in a steady glide. In the replay i recorded the time needed to glide from 500m right into the sea (crimea map), and that gave me the average vertical speed (in m/s). From the constant speed and the average vertical speed i could calculate the L/D ratio, which is the distance flown divided by the lost altitude (500m). If we were to compare the Spit MkVb, Spit MkIX, P51-D20, FW190 A6, FW190 D9, BF109 G2, TA152 H, what plane do you think is the best glider? Here are the polar curves, showing the vertical speed needed in order to keep the given air speeds. For comparison i've plotted the polar of a very popular modern glider that we have in our soaring club, the Discus 2b. It's minium sink speed in still air is 0.56m/s at 85kph. 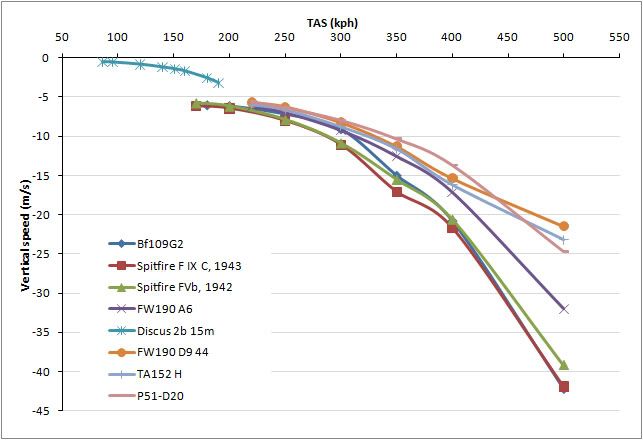 And here are the calculated L/D ratios. Yes the Discus reaches a distance of 45km starting 1km above ground 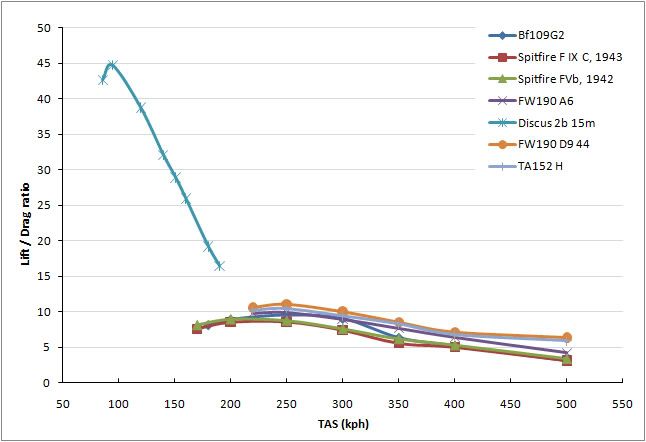 Let's have a closer look at warbids only. Both spits cluster together nicely, and the plots for spits and 109 are almost identical at higher speeds. Owing to their clean designs the Mustang, D9 and TA152 are the best of the bunch. At 500 kph their L/D is twice that of the spits and of the 109. What is weird is that the L/D ratio of the D9 and TA152 decreases at a slower rate between 400 and 500kph. Almost as if a drag generating device had been removed (think of flaps, rads, feathered prop). You see similar effects in gliders when they set their flaps to a negative setting at high speeds. However, i have no idea how this dent in the D9 and TA L/D plots comes about. The 109 plot shows a hump at 250 and 300 kph, which i've tested repeatedly. I can't explain it either, it seems not to be related to slats, as they were fully retracted (at least optically on the 3d model) at those speeds. 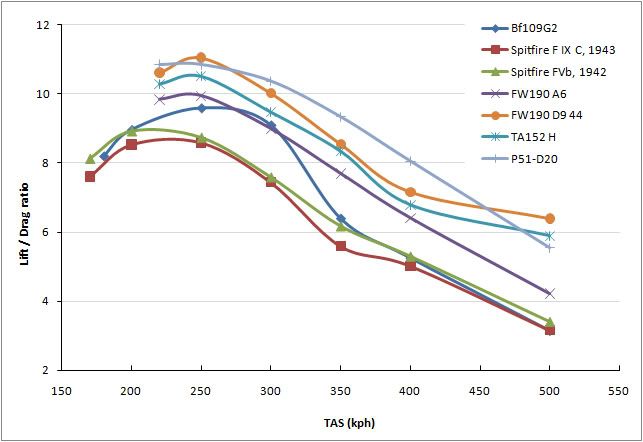 To investigate what effects props have i've compared polar curves flown with engine off vs idle engine, prop pitch 0%. As you see, an idling engine creates more drag at slower speeds, and less drag at 500kph. Go figure. 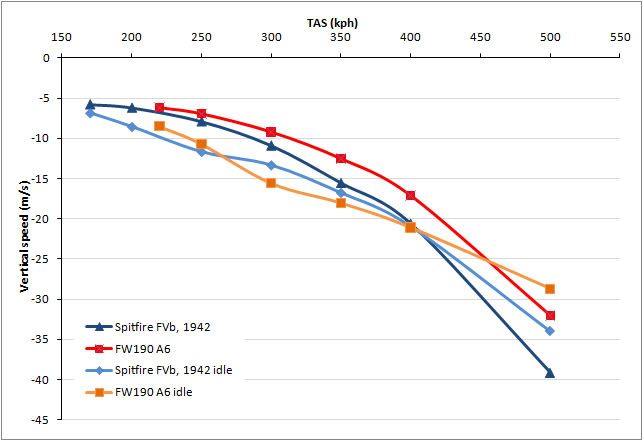 Any constructive feedback is greatly appreciated. Maybe you guys have a better understanding of the observed effects. S! 
|
|
|


 Threaded Mode